Es Donde Perteneces
Descubre la Iniciativa Hispana de WeStreet: un espacio creado especialmente para ti. Nuestra página en español ofrece educación financiera y detalles sobre nuestros productos y servicios.
Discover WeStreet in Spanish: a space created especially for you. Our website in Spanish offers financial education and details about our products and services.
The Money Management Trends Widget is a powerful tool that helps you understand your income and spending patterns over time. By visualizing your finances over 3, 6, 9, or 12 months, you can spot trends, identify opportunities to save, and stay on track with your financial goals. Regularly reviewing trends can help you make smarter spending decisions, plan for future expenses, and maintain overall financial wellness.
How the Trends Widget Works
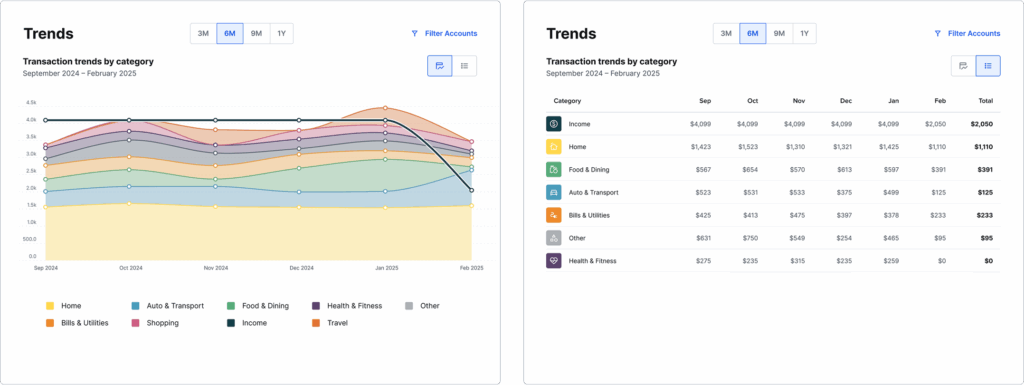
The Trends Widget provides a clear, visual representation of your income and spending. Here’s how to read the chart:
Y-axis = Spending in dollars: Shows the amount of money spent in each category.
X-axis = Timeline: Displays your selected time period (3, 6, 9, or 12 months).
Colored sections = Spending by category: Each color represents a different category, such as groceries, dining, or entertainment.
Grey line = Income in dollars: Tracks your income for each month, helping you compare earnings to spending.
By combining income and spending data in one chart, the Trends Widget gives you a big-picture view of your financial habits, making it easier to understand where your money is going and how your finances evolve over time.
Exploring Your Trends
The widget is interactive, allowing you to dive deeper into your financial data:
Hover over a category: See your spending history for a specific category over time.
Hover over a dot: View total spending for that month.
Select a category: Break it down further into subcategories for more detailed insights (for example, Dining Out vs. Groceries).
Select a dot: View all transactions for that month, giving you a clear picture of spending patterns.
By exploring your trends, you can identify areas to adjust your spending, notice seasonal spikes in expenses, and make more informed decisions about your financial priorities.
List View
Prefer a text-based view instead of the visual chart? The List View provides the same information in a structured, easy-to-read table format:
Switch views easily: Select the list button to toggle between the chart and table formats.
Category breakdown: Click a category to show its subcategories and associated transactions.
List View is ideal for those who want a quick overview or need a more detailed, line-by-line record of spending without relying on visual graphs.
Why Tracking Trends Matters
Understanding your financial trends isn’t just about seeing numbers—it’s about empowering yourself to make better decisions. By regularly reviewing income and spending patterns, you can:
Stay on top of monthly expenses and avoid overspending.
Identify opportunities to increase savings or reduce unnecessary spending.
Plan for upcoming large expenses or seasonal costs.
Monitor progress toward financial goals such as paying down debt or building an emergency fund.
The Trends Widget is designed to be a simple, intuitive tool that helps you take control of your money, visualize your financial behavior, and make adjustments before small issues become larger problems.